
By Michael Maynard
Abstract
Prior to the 2022 Major League Baseball season, Commissioner Rob Manfred implemented a lockout as negotiations for the next collective bargaining agreement (CBA) stalled. After ninety-nine days, the players’ union and owners agreed on a new CBA that featured an expanded playoff and small adjustments for player compensation rules. While the lockout was resolved in time for the season, the players are still troubled by the downward trend in player salaries since 2017, even as league revenue has grown. This paper equates this downward trend and the players’ unrest to the data analytics movement in baseball, popularized by Lewis’s (2004) book Moneyball on how the Oakland Athletics had successful seasons even with a small budget. As the MLB’s objective is to maintain a competitively balanced and entertaining product, the demand for players is important to consider when studying the lockout. Two regression models are tested for how team spending on players translates to wins in both the short-run and the long-run. The results indicate that spending more on player salaries has little correlation to wins in the short-run, but in the long-run spending has more of a noticeable effect.
Keywords: Collective bargaining, competitive balance, antitrust, demand for labor, sports economics, analytics, baseball
INTRODUCTION
On April 7, 2022, Major League Baseball ended its offseason and began its six-month, 162 game season. This year however, anyone involved with baseball is a little extra grateful for the arrival of this season, which was in jeopardy for a great deal of the winter due to the hostile CBA negotiations which culminated in a lockout. While the owners focused the product of baseball in order to maximize revenue, the players were afraid of the declining salaries, which they perceived as a signal that they were becoming less appreciated as front offices changed their evaluation techniques to follow new valuation preferences. This paper intends to relate and connect the trends in the past twenty years of Major League Baseball to show how the MLB arrived at its breaking point in the lockout, ultimately with the goal of painting the picture of how the surge of data and economic analysts into management of baseball teams is the main cause of the lockout, rather than greedy owners and players arguing over who deserves more money.
The year 2002 marks the beginning of the data analytics trend with the book Moneyball about the Oakland Athletics, who presented an applicable and successfully proven technique to win without a large budget. As reliance on statistics increases and teams discover more efficient ways to spend, player wages have decreased even as league revenue has continued to grow. General Manager Billy Beane asked the question of what would happen when the rich teams started doing what the A’s were doing. In the past twenty years, all thirty MLB teams have adopted the statistical techniques used in Moneyball, which has drastically altered the demand for labor in player services, and this shock has hurt players by reducing their value to inputs and outputs in a computer model. The hypothesis for the regression analysis is that spending on player salaries has decreased because there baseball general managers have concluded that spending more on player salaries does not lead to more wins.
LOCKOUT DESCRIPTION
In the history of American professional sports, labor stoppages are not a rare occasion. Every five to ten years, the players and owners must negotiate a new CBA, which outlines the rules of operation and bylaws of the league (Passan, 2022). Each of the NFL, NBA, and NHL experienced a lockout within the past decade, with the latter two resulting in a shortened season. MLB labor and collective bargaining negotiations had been rather calm since the notorious 1994 strike. The 1994 season was cancelled in the middle of the season, and went unfinished and with no champion crowned. Staudohar (1997) concluded that the four main factors of the 1994 strike were revenue allocation in collective bargaining, behavior in negotiations, and differing priorities of owners and players in negotiations. This description can be cut and pasted into the lockout discussion. However, in 1994, the strike was initiated by the players union, while in this lockout, the owners introduced the stoppage. Commissioner Rob Manfred, who represents the owners in collective bargaining negotiations, used the lockout option to initiate the stoppage.
Gruber (2002) studied how the 1994 strike affected consumer spending in the MLB following the work stoppage. The author concluded reasonably that there was a negative economic impact, which was related to consumers losing interest in baseball. Gruber (2002) surveyed fifty people at least 25 years of age with a moderate interest in baseball, intending to track changes in how consumers viewed the game of baseball. In terms of attendance in merchandise spending, the majority of those surveyed said they would spend less or about the same time and money on the MLB. 48% of people said they attended about the same number of games, and 40% said they attended less (Gruber, 2002). If the lockout would have delayed the regular season, the damage would not have been purely financial with lost revenues or wages. The public hostility from an extended lockout was the worst case scenario that neither the players nor owners wanted.
Players vs. Owners
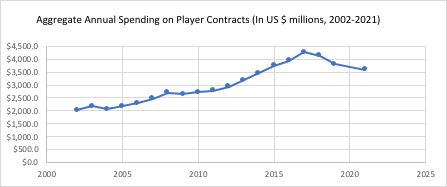
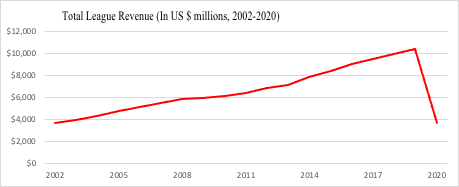
The fundamental cause of the 2021-2022 lockout stems from the reality illustrated in Figures 1-3. Figure 1 (MLB Payroll…2021) shows the total sum of all thirty MLB teams’ salaries per year, and how that aggregated total has changed over the past twenty years (2020 excluded due to pandemic season altering pay rates for the season). Figure 2 (Gough, 2021) shows the trend in league revenue over the same time period (with 2021 data unavailable). While the league has continued to experience positive growth in revenue, player salaries have declined since 2017. The players felt ripped off as the league became more profitable, yet were unrewarded for their role in the league’s success. Therefore, in negotiations, the players union, headed by Tony Clark, brought up the issues of the arbitration window and salary pool, the number of times a team could bring a player up and down from the minor leagues, minor league minimum wage, and service time manipulation. In addition, the players thought Manfred playing the lockout card was premature and sent a message to the players which was perceived to be negotiating in bad faith. Passan (2022) pointed out how Manfred claimed initially that the lockout was “a defensive lockout,” and his office hoped the lockout would spark negotiations. He then waited forty-three days to present an offer to the players.
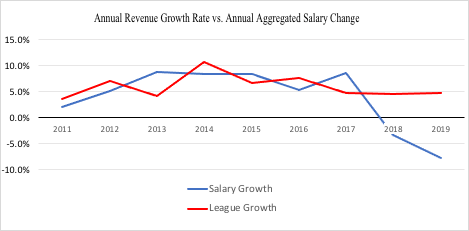
On the other side, the owners’ primary driving force was not their wage but profits. In Marx’s terminology, the owners are the bourgeois, and the players are the proletariat. Running a sports enterprise is different than a standard business because of the competitive dynamic concerned with wins and losses. A business’s main job is to return a profit, and a sports owner has that same motive, but success in that department is publicly overshadowed by the product on the field. Players earn their wages by just showing up and playing, while owners need to balance attendance and marketing, coaching staff and front office, and day-to-day team operations. All of these segments have expenses, and the revenue comes from how popular the team is in the community. Understanding the different pay structures between the two sides helps explain why they had such different priorities, and thus Figure 3 is such an important piece of the puzzle, because it essentially tracks the players’ wages and the owners’ profits. Therefore, the two sides argued over completely different issues because they had such different priorities.
Inspired by Gruber (2002)’s research, I conducted a similar survey meant to study the immediate effects of the lockout and to find which side the public was on. I gave the options “players,” “owners,” and “neither,” and hypothesized that the majority of respondents would either be indifferent or favor the players. Out of 40 responses, 45% sided with the players, 12.5% with the owners, and 42.5% were indifferent. Even on a smaller scale, the theme of the lockout is that the average to above-average baseball fan does not want to hear about the business of the sport, and just wants everyone to play. When comparing the lockout to the 1994 strike, the fallout was less dramatic because in the end, no games were cancelled, and with the exception of a few rule changes, baseball is not significantly different now than it has been. Costas (2000) wrote about the strike, “it finally forced many fans to conclude that the owners and the players had little but contempt for the game of baseball and saw it largely as a money-making instrument. This stance relates to the 42.5% who were indifferent in my survey.
In addition, coverage of the lockout tended to be more player friendly, as sympathy for the working class and laborers of baseball became easy to cultivate. Passan (2022) was the main reporter for ESPN during the lockout and was their primary source for informing the public about the lockout. The news and information were accurate, but the central claim of Passan’s (2022) analysis was “If you went and got the next 1,200 best players in the world, the product would suffer greatly. If you handed MLB teams over to any 30 competent businesspeople, the sport would not suffer.” This statement reflects a pro-player bias prevalent among the media and younger fans who see the product on the field as more valuable than the old guy making the decisions in the luxury suite.
Competitive Balance
One of the most prominent topics within sports economics in its early days has been the implementation of competitive balance, which refers to the level of parity from year to year. From an entertainment perspective, headlines drive the MLB. Fort (2003) suggested that preference psychology is the true issue in competitive balance, as a happy fanbase is one that is convinced in the preseason and frequently enough in the season that their team is a realistic contender. The audience does not want to see the same story over and over, and fans will not be interested if their teams are not competitive. This logic has been the basis of regulating player movement in free agency and between teams, which is why the MLB has maintained an anti-trust exemption to prevent player transactions from becoming an unregulated market (Renfro, 2022). From a litigation standpoint, competitive balance is the best framework to study how baseball’s infamous anti-trust exemption has evolved over time, and its present impact on the MLB.
Upon closer review, MLB’s noted anti-trust status is less of an exemption from the law as it is of a special case of governing enterprise. Renfro (2022) explained how both in Federal Baseball Club of Baltimore, Inc. v. National League of Professional Baseball Clubs (1922) and in Toolson v. New York Yankees, Inc. (1953), the Supreme Court held that baseball cannot be classified as interstate commerce. The MLB, from its inception concerned with the product of baseball, believed if players were left to choose to leave one team at the end of a contract and sell their services to another team, that the rich teams could just buy all the best players and create an unfair advantage. The league’s solution was to create the reserve system, in 1876, which gave each team exclusive rights to a player throughout their career (Knowles et. al, 1992). The anti-trust part comes by the government allowing the monopolies of player rights by restricting them to one team, unless their contract was sold or traded to another team. The monumental Flood v. Kuhn case in 1972 put the wheels in motion for the end of the reserve system, as the court sided with former player Curt Flood, who’s lawyer “argued to the Supreme Court that the reserve clause violated anti-trust laws by depressing wages and limiting a player to one team” (Gruber, 1994, p.10). In the fifty years since, with free agency the norm and days of restricted player movement long gone, Renfro (2022) asserted that the anti-trust exemption of baseball has been negated because of free agency, and the exemption will be removed as soon as Congress completes the legislation to do so.
This background provided the foundation for how economists have tested competitive balance, which has been largely concerned with the impact of free agency. Fishman (2003) studied how free agency affects competitive balance and developed an econometric model to measure competitive balance. Working to settle the claim that free agency has no effect on competitive balance, Fishman (2003) evaluated the flawed assumptions of the Coase Theorem, which proposed that the bargaining system (free agency or reserve system) was irrelevant, and a player’s market depended on marginal revenue product rather than the system. Coase’s theorem contradicted the prevailing logic at the time that free agency would eliminate any competitive balance. Fishman’s (2003) model showed that free agency did affect competitive balance, as there was a positive coefficient with the number of available free agents–supporting the owners’ argument–and therefore advocated for a luxury tax.
Fort (2003) dove deeper into the luxury tax discussion, which is dominated with the normative statement: “Payments from [the revenue sharing] pool should go to reward smaller revenue teams that perform above some expected level.” In Fort’s (2003) analysis, a luxury tax mitigates the externality when from wealthier teams spend more, which gives them a talent acquisition advantage. The MLB is the only league out of the big four American sports (MLB, NFL, NBA, NHL) that does not operate with a salary cap structure. In those other three leagues, every year a range is set with a minimum amount teams must spend on players and a maximum amount, which if they exceed, they must pay a progressive tax, with that money being redistributed to the smaller market teams that do not spend as much. Until former commissioner Bud Selig approached Congress in 2001 advocating for a salary cap (Passan, 2022), spending in baseball resembled a limitless auction. Rich teams could use their money and influence to sign all the best players and proceed to win the pennant; at least that was the prevailing mindset. Wanting more entertainment value for the MLB, Selig was able to get a competitive balance tax included into the CBA in 2003. However, Selig, who did have a personal interest as majority owner of a poor and unsuccessful Milwaukee Brewers team, was challenged by former Fed chair Paul Volker, who questioned why exceptions like Oakland occurred (Lewis, 2004, p.121). If competitive balance has ever been threatened by free agency, the owners needed more proof.
Since the early 2003, when the CBT was established and around when Fort’s (2003) and Fishman’s (2003) work was published, the MLB has seen a high level of parity in terms of who wins the World Series. 13 different teams have won a World Series, and 19 teams have played for one in that span. Passan (2022) does state that this level of parity is not a drastic change from before the CBT, when 14 different teams won a World Series and 20 teams played for one. A bigger factor in competitive balance is the number of teams that make the playoffs, which is why that issue was addressed tirelessly during the recent lockout.
The new problem of competitive balance, which has popped up occasionally in the other big American professional sports but has been very prevalent in the MLB is the increased practice of tanking. “Tanking” is a term that refers to an organization intentionally losing games, or at least trying to do so by assembling as bad of a team as possible. This process has strong incentives, for instance with the MLB Draft order being determined by the worst record in the prior season, but more profoundly with the MLB having a salary cap but no floor. Knowles, et. al (1992) prophesized this strategy in the foundation of their analysis, describing that “Although revenues may drop during the interim, team profits may not wane if costs are kept down, especially those associated with high salaried players who are not retained. From the league’s perspective strategy generates a negative externality because as the competitive balance deteriorates, revenues for other teams in the league may decline” (p. 73).
When tanking, owners and general managers operate with the assumption that if their team is bad, fans will not show up and watch the games, so ticket revenue will be low, and if they pay the players too much, they are paying a boatload of money for a losing team and will not make a profit. The Cubs and Astros were successful in large part because they won trades in the long-term, as they would trade their top players to contenders and get back a large number of minor-leagers who would be good down the road. As teams saw their former top prospects flourish at the big-league level in different uniforms, they became more reluctant to part with their top prospects, especially for players on expiring contracts. In other words, the nineteen-year-old stud from Central America became more valuable than the experienced and more costly MLB veteran. The result has been the present state of teams like the Orioles and Diamondbacks, who see no realistic path to winning that would make spending a lot of money on player salaries worthwhile, so they settle with being a low payroll team that earns a profit.
While it is easy to say that the root of the problem is in the owners prioritizing profit over wins, without a salary floor or reason to spend a minimum amount of money on players, the MLB has no way of incentivizing small-market teams to try, for lack of a better word. The lockout attempted to address this problem, as it will be shown, by the draft and the playoffs, but neither issue solves the owner conundrum of “if my team is not going to win, why should I spend the money I do not have.”
Review of Lockout
On March 12, 2022, the two sides agreed to put to rest the tension of the previous ninety-nine days and agree on a new five-year CBA (Anderson, 2022). Without knowing what took place behind those closed doors, they both sides likely recalled the 2020 pandemic shortened season that wounded the player-owner relationship and had made the latest negotiations a little extra spicy. Without a full season, the players cannot be paid and full, and as Figure 2 shows in 2020, the league makes a lot less revenue with less games (also keeping in mind that 2020 season did not have fans, so the attendance segment is likely a big factor).
The 99-day work stoppage resulted in a few main changes to the new CBA, which will seem rather trivial but need to be unpacked in detail. The players won in a few of their revenue earning manners. The league minimum salary was raised by $100,000 per year from the previous mark of $575,500 in 2021, and plyers who are not eligible for arbitration (before the fourth year of service time) can be given bonuses for their ranking in wins above replacement. (Anderson, 2022). Overall, players will be well-compensated earlier in their career, but the owners refused to budge on the six-year free agency window. The service time rule remained intact, but with an added asterisk that allowed for players who finished in the top two of Rookie of the Year voting to be awarded a full year of service. Previously, if a rookie made their major league debate after a certain date, their service time clock does not start for that year, giving the team an extra year of control before the player is due to hit free agency. Moving forward, this stipulation should create a better incentive for teams to call up their top prospects on Opening Day. Kris Bryant would have accrued a year of service time for his 2015 rookie season with the Cubs because he was the NL Rookie of the Year.
The owners won on two of their major points: Universal DH and expanded playoff. Traditionally, the MLB has always operated such that with a National League home team, pitchers bat for themselves, but with an American League home team, managers can use a designated hitter in place of the pitcher. As interleague play has expanded, there is little reason for this inconsistency, as it increases pitcher injury risk and puts under-qualified players at bat in the highest level of baseball. By adding a universal DH, the supply of hitters slightly increases, as more hitters become in demand, and fifteen players (one for each NL team), or the sum of such, will get consistent at bats. Considering that in almost every other level of baseball, including the minor leagues and spring training, college, and high school. The MLB also added a provision, primarily for Shohei Ohtani of the Angels who is the reigning AL MVP winner as both an elite pitcher and elite hitter, where a starting pitcher may also serve as a DH so that they can remain in the game to hit even after a relief pitcher is brought in. This rule allows for the rare exception where a good hitting pitcher can hit, but its major purpose is to help the marketability of the sport so that Ohtani, widely considered the most entertaining and marketable baseball player because of his versatility and Japanese heritage, gets as many at bats as possible.
The expanded playoff can be marketed as a potential solution to tanking, as with one more playoff spot in both the American League and the National League, average teams have more incentive to try and win enough games to make the playoffs. However, the real reason for the playoff expansion is how with the new format, the Wild Card round increases from two, winner take all games to four best-of-three game series. This round has a minimum of eight games if all four series are sweeps, and a maximum of twelve if all go to three games, so the MLB increases the amount of playoff games in this round by a factor of four to six given the year, which is an obvious appeal to revenue increase.
Adding a draft lottery have an impact on discouraging the practice of tanking. The NBA experienced similar problems with tanking in the past decade, most famously with the Philadelphia 76ers, but the connection of the draft to team success is more volatile in the MLB because most draft choices do not make it to the major leagues, or at least take a few years to do so. Fishman’s (2003) model demonstrated that the reverse-order draft indeed fosters competitive balance, so further alterations that create negative incentives for teams to finish at the bottom of the bottom should follow this pattern, and in theory this policy should work. However, the problem of poor teams refusing to spend money is still an issue, and with no salary floor in place, cost-cutting will continue amongst the small market teams like Baltimore and Arizona.
The main issues that both sides could unite on: No cancelled games. The players called the owners bluff when they threatened to cancel games to try and force the players to agree to a less favorable deal. In all honesty, if the players had wanted more, they could have pushed back harder, but their human calculators determined that anything additional they would be granted would be worse both money wise and publicity wise. The fans get a full season without the dark cloud over it. The casual fan can disregard the lockout as a pointless “millionaires fighting billionaires” debate and follow their team as they normally would.
However, the new CBA does not solve any of the complications from the analytics boom. In the past twenty years, front offices who assemble the teams and make the key organizational decisions have a better understanding of competitive balance, and how to optimize wins with spending. As a result, individual players mean less and less to team success as they ever have. Lewis (2004) told a story about a player Billy had acquired at the trade deadline that serves as an accurate depiction for how the treatment of “middle-class” baseball players:
There was little chance Billy would re-sign Ray Durham for next season. There wasn’t enough wrong with him. There wasn’t anything wrong with him. Durham had what every general manager in the game had always prized: pop in the leadoff spot, speed on the base paths, and a reputation, less deserved now than five years ago, as a good second baseman. In the free market Durham probably would be overpriced, but even if he was fairly priced, Billy wouldn’t keep him. There was nothing inefficient about the market for Ray Durham’s services. (Lewis, 2004, p. 264)
This Durham story prefigured what would be a massive reform in roster management in the next fifteen years, as Beane’s radical view of players like Durham became the norm in every front office. Teams realized that high on-base percentage led to high run-creation, and high run-creation led to more wins—which is why Billy Beane valued Ray Durham. However, when Durham was too expensive for his level of production, a team could sign another player with a similar on-base percentage at a lower cost. Baseball has become more knowledgeable about economics and data science, but there has been an overall negative impact on player markets. When the lockout is viewed in light of the analytics movement, it is hard to classify either side as wrong, because the owners want to find a balance of profitability and competitiveness, and the players simply want to be paid well for their contributions.
EFFECT OF ANALYTICS INFUSION: THE MONEYBALL EFFECT
To this point, the analysis has focused mostly on reviewing the headline progression from the lockout, the literature describing the legal operations of the MLB, and connecting the dots of the relevant MLB data to the lockout. This next section will transition to the most profound contribution of this paper, which is how the lockout is closely related to the management changes in front offices across players with the infusion of data analytics. The process of valuing players has changed dramatically, which has affected how players are compensated.
One question lingers over the discussions of competitive balance, free agency, tanking, and the player vs. owner dispute: What is the relationship between money spent on player salaries and successful that team is? The overview of competitive balance suggests that the teams with the money have a significant advantage, but this assertion does not always hold true. Lewis (2004) told the classic story of the 2002 Oakland A’s, who relied on a Harvard economics graduate with a new way of valuing players to compete with the teams who stole their top players in free agency. Sawchik (2015) described a more recent and less heralded case study of the 2013 Pittsburgh Pirates, who with similar constraints found value in pitch-framing and infield shifts. These two case studies support the hypothesis that winning baseball games is not closely related to how much a team spends on players, as finding players who can execute the team’s strategy is more important. If there is no correlation with large payrolls and good records, teams become averse to large contracts, which explains the aggregate salary decrease beginning in 2017.
In the analysis, data was used from the 2002 thru 2021 seasons, excluding the pandemic shortened 2020 season. The number of wins is the dependent variable, with the annual salary to be tested with a single regression analysis. Two ways were developed to represent spending effect on wins: A short-run model, where every team from every season is studied as an individual data point, and a long-run model with each team’s total wins and total spending on players added up for the twenty-year period.
Methodology and Results
In Figure 4, the short-run model, the r-squared term from every team’s win output given their Opening Day spending is .1062 as there is virtually no correlation between spending and wins for one season. In Moneyball, Lewis (2004) used a concept from Bill James, the father of baseball analytics, called the law of competitive balance. James writes from his 1983 Abstract “There exists in the world a negative momentum which acts constantly to reduce the differences between strong teams and weak teams, teams which are ahead and teams which are behind, or good players and poor players (Lewis, 2004, p. 257). James goes on to describe how any strength is also a weakness and vice versa, how the balance of strategies favors the underdog, and the psychological affect which moves winners down and losers up (Lewis, 2004, p. 258).
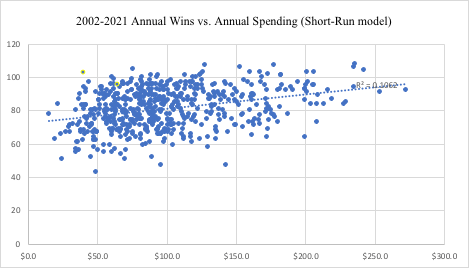
In simplified terms, James claimed that baseball is mostly luck, which the short-run model confirms on a year-to-year basis. Lewis (2004) references a nugget from baseball sabermetrician Pete Palmer, “who once calculated that the average difference in baseball due to skill is about one run a game, while the average difference due to luck is about four runs a game (p. 274).” The Moneyball insight is how the playoffs are more about being lucky than being good, prompting a famous quote by Billy Beane from the book “My job is to get us into the playoffs. What happens after that is luck” (p. 275). Compared to a five, seven, or with the new expanded playoff format, three game sample size, 162 games are a much truer depiction of reality, and the law of average will be enforced more often over five months of baseball than over one. However, over twenty years, this same principle of averages would be expected to further apply, as one good season can happen in isolation, but good organizations win consistently. Therefore, the regression analysis shown in Figure 4 is not strong enough to conclude there is no relationship between player spending and wins.
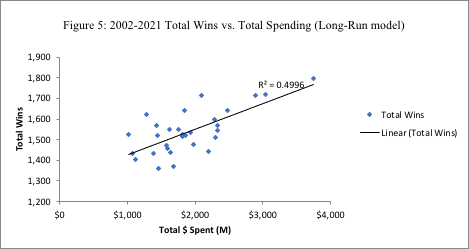
The long-run model for player spending effect on winning (Figure 5) studies each franchise’s total payroll input with their total output of wins over 20 years. The variables are the same, except instead of studying every team’s individual season, each team is grouped by total wins and total spending over the twenty years. The result in the regression is a much stronger relationship, with an r-squared term of .4996. Over twenty years, there is a relationship between player spending and wins that can explain about 50% of the variability.
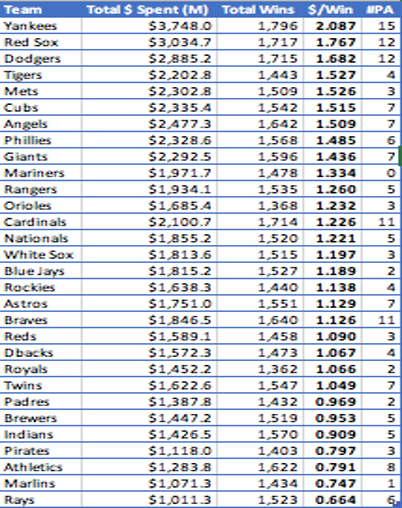
Table 1 introduces a supplementary insight into long-run analysis, labeled as the dollar per win ratio. This metric helps define the rich teams and the poor teams because it compares how much each team spent to obtain one win. In this table, judging individual teams’ spending efficiency is much easier to visualize than the two regression models, which merely look to see if a trend is present. As discussed with the short-run model, making the playoffs is the main objective, and Table 1 shows how many playoff appearances each team made in those twenty years. The Yankees, Red Sox, and Dodgers all spent the highest per win, but each were vindicated by making the playoffs nearly every season. On the other hand, the Tigers and Mets were the leaders in wasteful spending, as their deep pockets did not translate to many good seasons. The Cardinals and Braves made the playoffs very often despite more modest spending on players, embodying a happy medium where spending near the middle of the pack could still lead to success. Finally, the Athletics and the Rays made the playoffs at a higher rate than most mid-market franchises despite spending two of the lowest amounts of money on player salaries per win. The diversity in team success stories creates the appeal of sports, but over time, successful organizations are more clearly identifiable because their strategies have more time to work.
Discussion
With this perspective of assembling the cheapest team that is competent by the desired statistics, it begs the question of why teams still spend a lot of money. Well, Billy Beane was the only one of thirty teams at the time with the on-base insight, and after their success, teams began copying him. The reality that the A’s and Pirates lived in that became the fundamental lament as Moneyball was made into a movie was how the teams that created the advantage ended up losing their advantage when the richer teams copied them, and they players they found undervalued were no longer such because every team values them higher, and the market adjusts. The 2013 Pirates example is an important to consider because the Pirates needed to innovate in terms of what data they found valuable, which they determined were pitch framing and infield shifts. Any MLB game in 2022 features catchers who are adept at selling borderline pitches as strikes and individualized positioning of fielders to match a specific hitter’s tendencies. Essentially, market preferences change as more teams value players differently and more efficiently, so an equilibrium emerges in that the diamonds in the rough become valued as marquee players, while players with less desirable skills have a tougher time finding a starting job.
Once the market adjusts, any inefficiencies occur due to the fact that major league general managers need to be concerned with fan interest and public morale. The easiest way to boost morale and interest is to bring in a bona-fide superstar. At the top of the market, free agency becomes less about production than it is about celebrity status. When a team signs a player to a big deal, they signal to their fan base that they want to be more competitive, so what they are essentially buying is their fan’s support in attendance and eyeballs. In the short-run, a team can justify not spending a lot of money on players because they are rebuilding and do not see a competitive window for their franchise, but in the long-run, the teams that do not spend are perceived to not care about winning.
From 2019-2022, there were 42 instances where players signed contracts in free agency for over $50 million in total. Of those 42, only seven re-signed with their team, so the dominant view with expensive free agents is to “let someone else can pay the money, we can find a replacement.” In the 2019 season, the Washington Nationals won the World Series despite losing Bryce Harper in free agency the prior offseason to the division rival Philadelphia Phillies. Even as Harper has put together an MVP season in Philadelphia, Juan Soto effectively matched Harper’s lost production in 2019, and the Nationals used the money that they would have spent on Harper ($25 million per Spotrac) to sign Patrick Corbin for $23 million annually, a left-handed starter who would be a huge factor in the playoffs. A year after making the World Series in 2020, the Tampa Bay Rays traded a Cy Young winner in Blake Snell and let their ace Charlie Morton, a pitcher with playoff success with the Astros and the Rays, sign with the eventual world champion Atlanta Braves. The Rays still won 100 games and the division in 2021, despite having the fourth lowest payroll in the MLB.
As efficient as those Athletics and Pirates teams were, their competitive balance disadvantage comes in the long-run rather than the short-run because the rich teams like the Yankees and Dodgers can pay for the highest valued players no matter the circumstances. When Bud Selig made his complaint about competitive imbalance in the MLB, he is correct that wealthier teams have an absolute advantage, but he is incorrect that all spending is bad and must be curtailed, because player spending is the result of a market that with data science, becomes more efficient. To the hypothesis that player spending and winning are not correlated, there is one model that supports the hypothesis and one that does not, so the discovery of this investigation has been that player spending has an unpredictable effect on wins and losses on one particular season, but in long term planning, spending more money on players has more of an effect on winning more games.
Further Consideration
Unlike the models of Fishman (2003) and Knowles, et. al (1992), my regression analysis only tests one variable, primarily because of the purpose of relating to the lockout, which was so concerned with the player salary drop, but also because there are not really any other variables that fit here. If player spending is explaining about 50% of long-run team success, it would be reasonable to assume coaching or development factors should be studied as well. However, this approach would likely carry multicollinearity, as the teams that have the money to pay their players more would also have an ability to pay more for managers or even general managers. Average attendance could be a variable worth including, but this tough to relate as well because of how obvious winning is related to community interest. Contributions to the discussion on other relevant variables are welcomed, but for now, 50% in the long-run model is the best way to justify spending money on players to try and buy wins
The time periods of one year and twenty years are also subjective, and in future analysis more intermediate periods could be evaluated. The increase from 10% correlation for one year to 50% over twenty years would not be expected to be a linear path, but there is probably a point somewhere in between where a team can define a set number of years as being “the long-run.” This future insight could help front offices understand how long it can be expected to take for an increase in player spending to lead to wins.
CONCLUSION
As the 2022 MLB season now proceeds as scheduled, with the ugliness of the lockout negotiations in the rearview mirror, baseball fans and even the players and owners can move forward as if the lockout was just a necessary labor dispute where both sides could air their grievances. Assuming that baseball maintains an audience, players will still be paid a lot of money to play a children’s game at an elite level, and owners will lord over a company with very low risk of losing money. Aside from an expanded playoff and fans of National League teams adjusting to having a designated hitter in their lineup every day, the lockout does not have an earthshattering impact. However, the growth of data analytics in baseball, best described in Moneyball (2004)and Big Data Baseball (2015) presents the lockout as a byproduct of the changing nature of baseball due to the mass amount of data and statistics front offices have access to. The lockout was most directly caused by players becoming less valuable in the traditional views of which qualities of players were most desirable.
When the lockout concluded and players were allowed to have contact with teams, Kris Bryant–whose perceived mistreatment in 2015 sparked many of the players’ arguments in this lockout–still received a mega payday in free agency, as did Carlos Correa, Trevor Story, and Freddie Freeman. However, all left for new teams, who will replace their lost production in the system the Oakland Athletics popularized across baseball: Find more cost-efficient or younger players who can replicate the lost production in the long term, because veteran players will not remain productive forever and younger players have a higher quantity of potentially productive years. When stripped to its bare bones, managing a baseball team is purely understanding opportunity costs and understanding marginal changes. The teams with the best understanding of economics are the teams that have the most long-run success, which is the best insight into the other 50% that accounts for wins in the long-run model.
Consequentially for the players, owners using economics well has meant smaller salaries across the board (Figure 1). For front offices, who assemble the team the owners have to be accountable for, building a team on a budget is the most efficient way. There is no reason to go into the luxury tax, because teams have proven they can win without doing so, and because spending heavily and still losing creates negative organizational perspective. Additionally, with no minimum mandate, there is no regulation on how cheap teams want to be.
Therefore, the fairest policy for the players would have been to shorten the service time requirement before free agency from six years to five or even four years, but the owners repeatedly stood their ground in maintaining the six-year requirement. For the players, this cause was the only issue worth holding out longer where games would be cancelled. This change would have been an uphill battle because of the common goal of both sides to have a full season to maximize revenue and player salaries. The owners had the leverage because if they players would have pushed back harder; the owners could refuse to budge on the service time issue until the point where they determined they would need a certain number of games to avoid the 2020 disaster from occurring again. Additionally, implementing a salary floor would have went against the tradition of the MLB not using a salary cap, but it would have been the best way to combat tanking, and also prevent the wage-profit discrepancies shown in Figure 3, as players would be paid more when the league is more profitable.
Baseball is at a point where players need to educate themselves on what skills the computers and data analysts consider valuable. While the players are the ones who are irreplicable to the MLB’s image as Passan (2022) asserted, they are not the ones who decide what skills and qualities are desirable for wins, which general managers set by determining how to value player utility. The reality of baseball is that the elite players are going to get paid well and will get opportunities later in their careers, but for the majority of the “middle class” of baseball consisting of platoon starters, short relievers, and career minor leaguers, the new CBA does not do any more favors that the previous one to those who may not make it to free agency in time to get their big payday. Players and coaches need to be flexible to how baseball changes and develop the skills that will not only lead to more team wins but individually get them paid. The owners can be blamed as the instigator of the lockout, but if the players are unwilling to adapt to the ever-changing nature of the game, they have responsibility for the lockout as well.
As I contribute this senior thesis project to the business department of Franciscan University of Steubenville, I do so in the university’s mission to make joyful disciples and proclaim the good news to the ends of the earth. I ask for the intercession of Saints Christopher (baseball) and Sebastian (athletes), as well as the renowned doctor of the church Saint Augustine, who preached to many wealthy parishioners and therefore watches over the businessmen who run professional baseball teams. I pray that the players, coaches, and executives who steward over America’s pastime learn to keep Christ at the center of their pursuits in sports and strive for the common good in negotiations by prioritizing human dignity before personal success. As a fan and aspiring economist, these references have helped me understand the reality of baseball better, and I hope my analysis can explain how the lockout is an effect of the larger world movement to integrate data analysis and statistics into business operations. In pursuit of graduate studies and as I continue to be exposed to sports economics and contribute more articles and papers about sports, I intend to grow my knowledge about data analytics and statistical tools so that I can further contribute to modeling baseball outcomes.
REFERENCES
Anderson, R.J. (2022). MLB lockout ends as MLBPA, owners reach CBA agreement: Five
takeaways with baseball set to return. CBS Sports.
https://www.cbssports.com/mlb/news/mlb-lockout-ends-as-mlb-owners-reach-cba-
agreement-five-takeaways-with-baseball-set-to-return/live/amp
Costas, B. (2000). Fair Ball: A Fan’s Case for Baseball, Broadway Books.
Fishman, P. (2003). Competitive Balance and Free Agency in Major League Baseball. The
American Economist, 47(2), 86–91. https://doi.org/10.1177/056943450304700208
Fort, R. (2003). Thinking (Some more) about Competitive Balance. Journal of Sports
Economics, 4(4), 280–283. https://doi.org/10.1177/1527002503257322
Gough, C. (2021). Total revenue of Major League Baseball 2001-2020. Statista.
https://www.statista.com/statistics/193466/total-league-revenue-of-the-mlb-since-2005/
Gruber, A. (2002). The effects of the 1994 Major League Baseball strike on the business of
professional baseball [Master’s thesis, Lynn University]. SPIRAL.
https://spiral.lynn.edu/etds/101
Knowles, G., Sherony, K., & Haupert, M. (1992). The Demand for Major League Baseball: A
Test of the Uncertainty of Outcome Hypothesis. The American Economist, 36(2), 72–80.
https://doi.org/10.1177/056943459203600210
Lewis, M. (2004). Moneyball. W.W. Norton & Company, Inc.
MLB Payroll 2000-2021 (2021). Fueled By Sports. https://www.fueledbysports.com/mlb-
payrolls/
Passan, J. (2022). Inside the self-inflicted crisis boiling over as MLB’s lockout deadline arrives.
ESPN. https://www.espn.com/mlb/story/_/id/33362477/inside-self-inflicted-crisis-
boiling-mlb-lockout-deadline-arrives
Renfro, Adam, “2022 MLB Lockout: Time to Re-Examine Baseball’s Antitrust Exemption”
(2022). SLU Law Journal Online. 90.
https://scholarship.law.slu.edu/lawjournalonline/90
Sawchik, T. (2015). Big Data Baseball. Flatiron Books.
Staudohar, D.P. (1997). Monthly Labor Review, March 1997.
2019 Washington Nationals Free Agents. Spotrac. https://www.spotrac.com/mlb/free-
agents/2019/washington-nationals


Leave a comment